

Eurasia - stretching from Vladivostok (Russia) to London - is a geographical fact
Very hard to conceptualize in geopolitics, its attraction, acting like a magnetic field, cannot be ignored any longer
This new reality is coming to light with the Chinese "Belt and Road' plans of communication infrastructure on a continental scale
Expanding trade opportunities and the riches of trans-continental energy markets - mostly oil out of Kazakhstan and gas out of Turkmenistan - are powerful drivers integrating the Eurasian landmass like never before
With China's engagement, the projection of Eurasia raises provocative questions for all the great powers of the continent
Russia's partnership with China could be short-sighted and Europe's lofty wait-and-see strategy possibly could catch the Union wrong-footed
The Asian 'Stans' - from Kazakhstan to Turkmenistan - at the center of the Eurasian chessboard seem like a good place to scale some of the profound transformations in wait
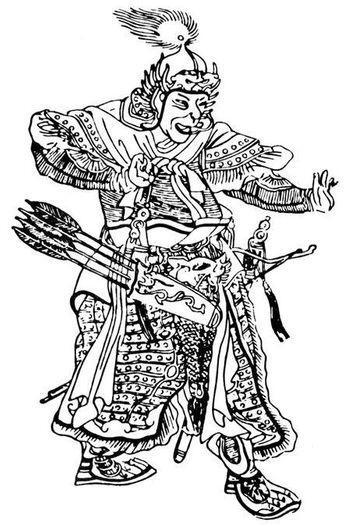
Eurasia, the Europe-Asia continental landmass, has not been seen as a geopolitical entity since the Mongol invasion of Central Europe during the 13th century (1206-1405), planned and executed by Genghis Khan’s military strategist Subutai (1175-1248)
Subutai, who directed more than 20 campaigns and won 65 battles in China and in Central Europe, was a major innovator in the art of war
His campaigns demonstrated an unprecedented level of complexity and strategy, making full use of speed, coordinating armies of hundred thousand men, hundreds of kilometers apart, and recognizing the value of siege engines and artillery bombardment in field battles before any contemporary military commander
With Subutai’s planning for the invasion of Central Europe, the grandsons of Genghis Khan conquered Volga Bulgaria, Cumania (today’s Romania and parts of Hungary) and East Slavic principalities (most of today’s western Russia, Byelorussia and Ukraine) and the ‘Golden Horde’ pushed further into Poland, Czech lands, Hungary and Austria, all falling under Mongol dominance by the 1240’s
After 600 years of European Nation-State history and colonial expansion, it is hard to conceptualize politics in the Eurasian geographical frame but, acting like a magnetic field, its attraction cannot be ignored
This new reality is coming to light with the Chinese "Belt and Road' plans of communication infrastructure on a continental scale
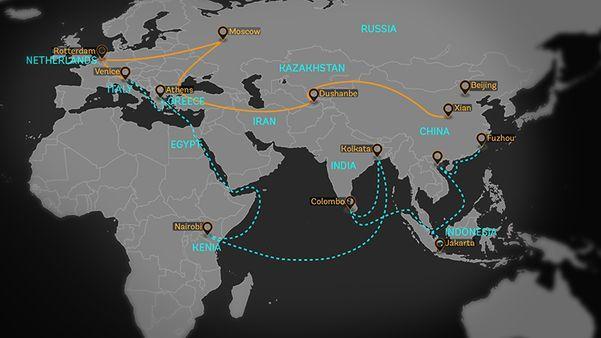
Adding to the attraction of trade, the riches of trans-continental energy markets - mostly oil out of Kazakhstan and gas out of Turkmenistan - are acting as a powerful driver, engaging China directly, with Europe not far behind
Developments in the short term are bound to remain haphazard
Preconceived national interests, deeply rooted in the domestic affairs of each country, are likely to integrate the broader Eurasian perspective only piecemeal and reluctantly
In Central Asia, the very heart of Eurasia, the interests of China, Russia and Europe may collide … or these land powers could find a way to cooperate, exploring gingerly to what extent their willingness to engage finds common ground
Central Asia's unequally shared riches
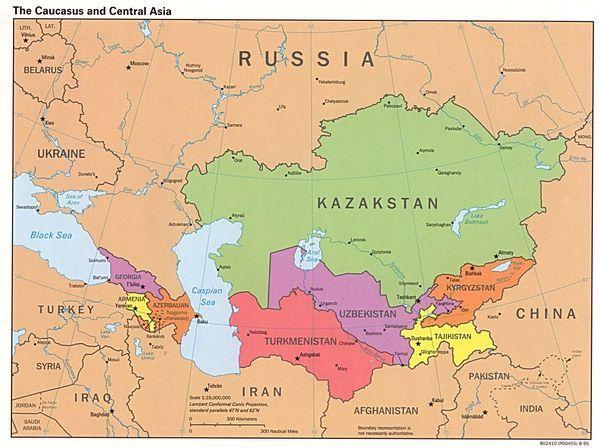
Wedged between China to the East, Russia to the North, Iran and Afghanistan to the South, Central Asia is the gateway to Western markets for Chinese exporters, in the shadow of a reinvigorated Russia (its patron of old) and a fount of energy riches tempting Europe and China, still under the watchful eye of Russia...
Population growth in the region has been strong - tripling from 23.4 million (1959) to 73.7 million (2019) in 60 years
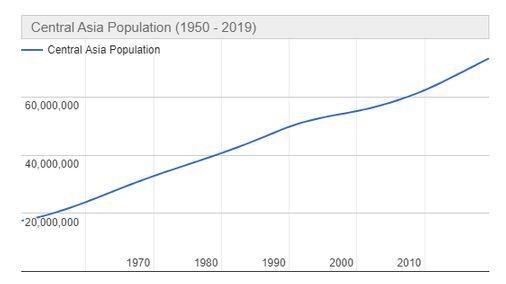
Since 2000, population increase has been fairly similar across the region, with notable exception of Tajikistan, by far the poorest country of Central Asia and Kazakhstan, by far the richest...
| Population (2019) | Population (2000) | 2019/2000 | |
|---|---|---|---|
| Uzbekistan | 33 193 849 | 24 769 955 | 34,0% |
| Kazakhstan | 18 649 587 | 14 922 719 | 25,0% |
| Tajikistan | 9 414 894 | 5 764 810 | 63,3% |
| Kyrgyzstan | 6 462 948 | 4 920 712 | 31,3% |
| Turkmenistan | 5 980 862 | 4 516 133 | 32,4% |
| Central Asia | 73 702 140 | 54 894 329 | 34,3% |
| source worldometers.info | pininvest.com | ||
As marker of the quality of healthcare, the United Nations Population Division records statistics of deaths per 1000 under the age of 5 and wide differences only partially reflect the relative GDP of each country
Kazakhstan's wealth translates in the lowest record of deaths (8.5 per 1000 - compared to 7 per 1000 in the US) but with nearly identical GDP ($40bn), Uzbekistan (at 23.2 per 1000) suffers half the deaths recorded in Turkmenistan (47.1 per 1000)
One of the two poorest countries, Kyrgystan declares 15.6 deaths per 1000, which seems to imply significantly better care of the population's basic needs
While newly found energy wealth is the primary factor, Central Asia's inclusion in the former USSR has effectively left these countries with the benefit of a well functioning healthcare service, still supporting the populations of energy-poor Kyrgystan and Uzbekistan
By a significant margin, Kazakhstan remains Central Asia's most favored nation, although the sharp GDP drop between 2013 (USD 213bn) and 2016 (USD 137bn) attests of its dependance on oil exports
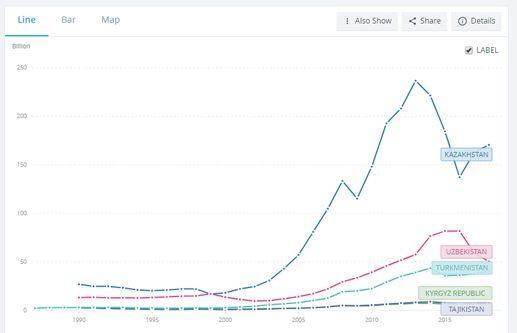
On a per capita basis, Kazakhstan sets a record (USD 9300) with a relatively small population (25% of total Central Asia) benefitting from the country's oil wealth
| in 2018 USD | Population (Dec.2019) | GDP billion | per capita GDP | ||
|---|---|---|---|---|---|
| Uzbekistan | 33 193 849 | 45,0% | 50 | 18,1% | 1 500 |
| Kazakhstan | 18 649 587 | 25,3% | 170,5 | 61,6% | 9 300 |
| Tajikistan | 9 414 894 | 12,8% | 7,5 | 2,7% | 830 |
| Kyrgyzstan | 6 462 948 | 8,8% | 8 | 2,9% | 1 300 |
| Turkmenistan | 5 980 862 | 8% | 40,8 | 14,7% | 7 000 |
| Central Asia | 73 702 140 | 100% | 276,8 | 100,0% | |
| source The World Bank | pininvest.com | ||||
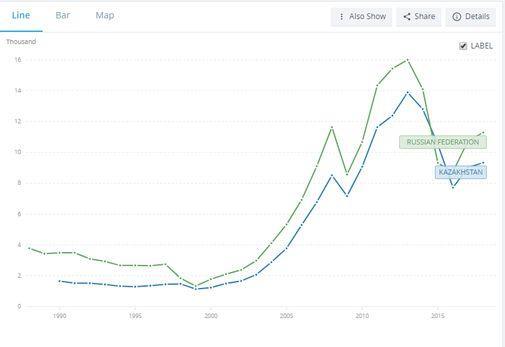
A comparison between Kazakstan's and Russia's per capita GDP reveals nearly identical growth patterns - with Russian GDP per capita increasing 9 times from a low point of USD 1330 (1999) to USD 11300 (2018) and Kazakhstan GDP reaching USD 9300 from USD 1130
Turkmenistan's gas reserves have been a source of fast growing wealth over the past 20 years, with per capita GDP rising from USD 550 (1999) to USD 7000 (2018)
Turkmenistan's per capita wealth and dismal statistics of life loss under 5 years (47.1 per 1 000) is in striking contrast with the two poorest countries, located on the Chinese border - Tajikistan (USD 830 per capita) and Kyrgyzstan (USD 1300) with death rates under the age of 5 of respectively 26.7 and 15.6
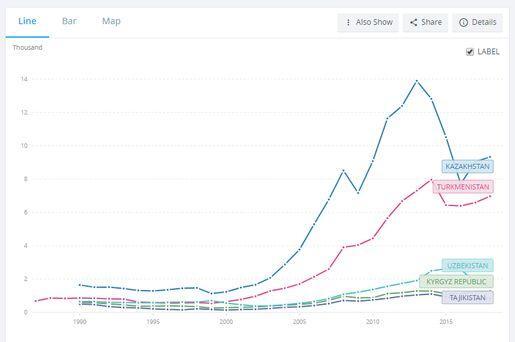
Uzbekistan's low GDP per capita of USD 1500 reflects its large population (33.2 million - 45% of Central Asia's total) and limited energy resources, with 6% of known gas reserves of neighboringTurkmenistan and 2% of Kazakhstan's oil, as the yearly BP Statistical Review makes clear (p.32)
Extreme unbalance in natural resources - which allowed Kazakhstan and Turkmenistan to 'break out' from the early 2000's in spectacular fashion - left their Central Asian neighbors struggling
This is also why the exposure to Chinese debt of Kyrgyzstan and Tajikistan - both poor and bordering China - comes as no surprise as we hope to discuss in our follow-up note on energy and cashflows 'Central Asia pipelines'
We presented the Horn, Reinhart & Trebesch study (July 2019) in 'China's overseas lending' and the warning flashing in the data set foretells the region's potential fragmentation
| in million USD | ChinaDebt | CountryGDP | ChinaDebt_GDP | |
|---|---|---|---|---|
| Kazakhstan | 2006 | 372 | 81 000 | 0,5% |
| 2017 | 5 830 | 159 400 | 3,7% | |
| Kyrgyzstan | 2006 | 78 | 2 837 | 2,7% |
| 2017 | 2 305 | 7 565 | 30,5% | |
| Tajikistan | 2006 | 604 | 2 811 | 21,5% |
| 2017 | 1 154 | 7 144 | 16,2% | |
| Turkmenistan | 2006 | 354 | 21 390 | 1,7% |
| 2017 | 5 088 | 37 930 | 13,4% | |
| Uzbekistan | 2006 | 270 | 17 330 | 1,6% |
| 2017 | 3 679 | 48 830 | 7,5% | |
| source - Horn, Reinhart & Trebesch data set (2019) | pininvest.com | |||
Data set specifications for debt stock owed to China, as provided by the study
ChinaDebt - Estimated total external debt stock owed to China in billions of USD; this series includes debt by private and public entitities to Chinese state-owned creditors. It includes only debt from direct loans, and excludes short-term trade debt, swap debt and portfolio debt.
CountryGDP - Nominal GDP in billions of USD from the IMF's World Economic Outlook database (Oct. 2018)
ChinaDebt_GDP - Estimated total external debt stock owed to China in percent of debtor GDP; this series includes debt by private and public entitities to Chinese state-owned creditors. It includes only debt from direct loans, and excludes short-term trade debt, swap debt and portfolio debt.