
Our Small Caps and Sector Rotation signaled the growing divergence between the assets with the smallest- and the largest- market capitalization, suggesting renewed weakness in the market on Dec. 21
The call proved to be correct (as was our previous report on Downturns and Small Caps of Dec. 14)
In the wake of the sharp downdraft in the equity market – and equally sharp reversals – observed since October ’18, volatility has jumped after an extended period of down trending during the year
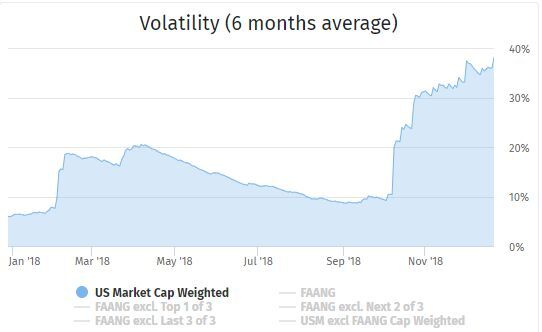
Volatility is the measure of risk exposure – reflecting the fluctuation of prices over a period of time – which means that, on any given day, volatility is an average calculated over the daily price history of a preset time frame
On the pinindices, charts, all volatilities are calculated over a price history of the previous 6 months
This means that any notable price variations – and resulting volatilities – which intervened during those 6 months will be accounted for in the average – a ‘ghost’ effect of past fluctuations which impacts the reading of volatility averages over time
To downplay earlier price variations which intervened some months back (within the 6 months reference frame), pinindices adjusts the volatility by calculating the average as EWMA (exponential weighted moving average)
EWMA gives greater weight to the recent price variations, by ‘fading’ the more distant returns, and the reading of our charts of volatility history should be closer to an investor’s market perception
Because of the special attention paid to the FAANG assets (Facebook, Amazon, Apple, Netflix and Google – to which we add Microsoft) over the past year, we present screenshots – as of Dec. 26, 2018 – from the dedicated pinindices interface
While the calculation of volatility, based on the standard deviation of returns, is difficult to apprehend, the comparison of volatility charts on a single table – for different segments of the Total Market index or for the FAANG assets – will be a significant indicator of risk
Volatility history – for the past 3 months – is drawn with the data points of average volatilities (the ‘earliest’ point, 3 months ago, is based on the price fluctuations of the 6 previous months), of course applying the EWMA as discussed
The reader may access the relevant charts, set preferred time frames and select the most relevant market segments –Access to pinindices is free (no registration required)
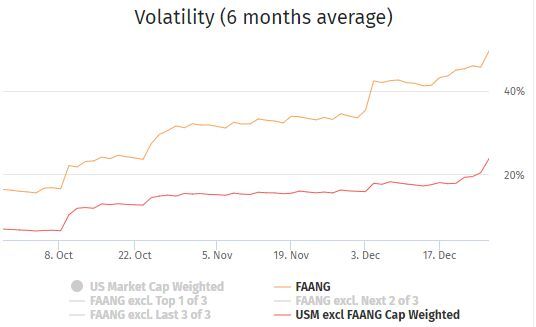
The constituents of the FAANG portfolio (including Microsoft) are market-cap weighted
The comparison with the Total Market USM excl FAANG shows in spectacular fashion both the moderating impact of diversification in the global portfolio and the significant market risk of the concentrated FAANGs, impacted by the recent fluctuations of the 6 constituents
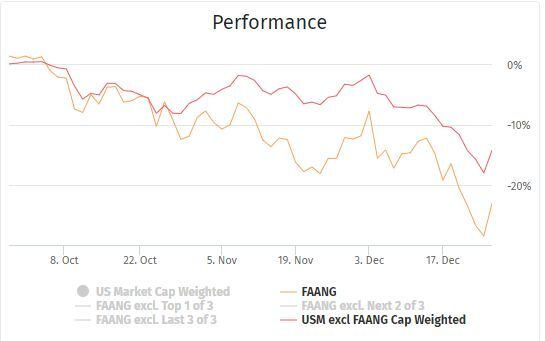
In terms of performance, again over the past 3 months, the comparison is no less significant with a 10% excess loss suffered by the FAANG (-23%) over the global market (USM excl FAANG) (- 14.25%)
Moving forward, we conclude
- the FAANG assets should probably be a small part of a diversified portfolio
- investor portfolios with an overweight in FAANG assets, in the expectation of a market reversal, are likely to remain more volatile – and more risky – on average
- tracking FAANG performance is only one of the many available market trackers. An investor may want to check pinindices on a frequent basis in a stressed market