
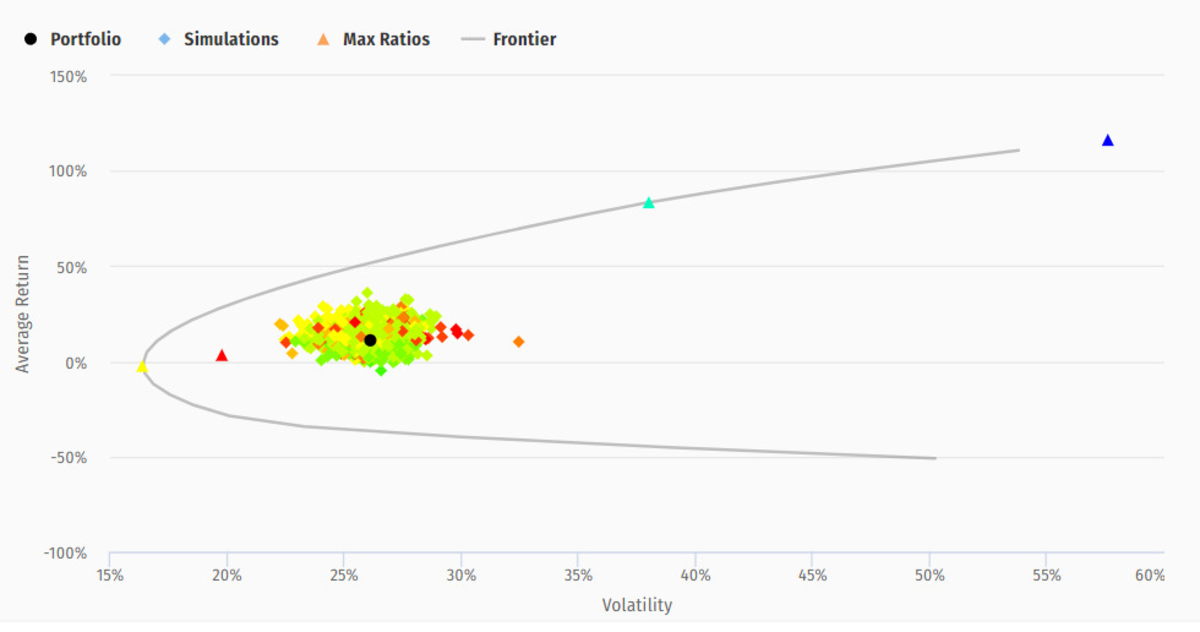
Optimization simulates an array of porfolios, reweighting the selected assets of each portfolio separately
Highlighing the link between performance and risk, the portfolios represent a close to infinite number of asset combinations
Optimization does not recommend a single ideal asset selection
This would be impossible
- Investments in a portfolio reflect an investor's personal appetite for risk and expectations of performance
- Performance and risk (measured by volatility) shift over time with asset prices - generating continuous adjustments to optimized selections
If optimization is not a path to ideal portfolio construction, the signals generated by portfolio optimization still hold valuable information
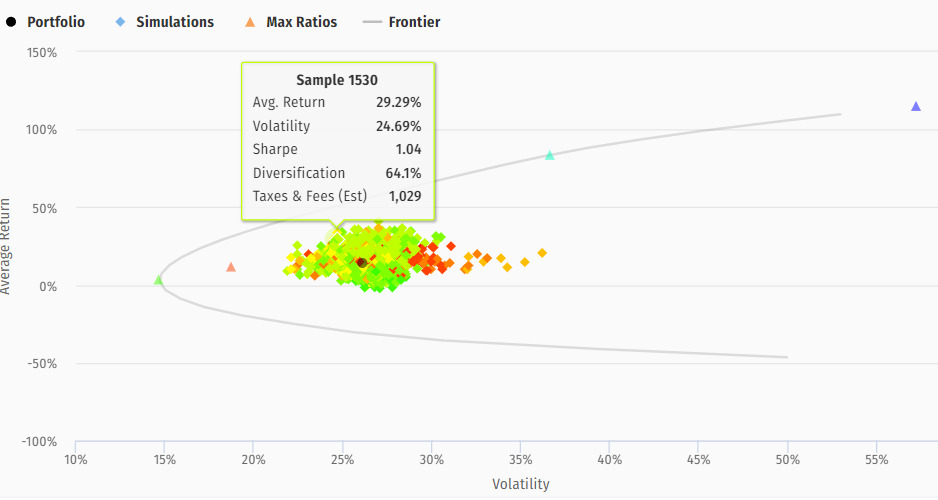
Focusing on the entire array of portfolios
- the 'virtual' portfolios are measured against the actual portfolio held by the investor (marked by a dark dot on the screenshot)
- highly similar portfolio simulations are eliminated and the remaining portfolios are grouped into clusters
- 'virtual' portfolios close to the investor's performance expectations and risk sensitivity are worth exploring
- with better diversification (marked by red dots in the diversification view), both performance and risk exposure might be positively impacted by balancing the portfolio
Gaining an understanding of the constraints filtering the computer generated portfolios
- maximum weight limits prevent concentration on a few assets with favorable performance - volatility history to the detriment of diversification
- clustering the portfolio array around the invested portfolio focuses on potentially relevant reweightings - by adjusting the α-distribution parameter
- boundaries assigned to the number of reweightings allowed in the array limit the number of trades to practical recommendations
Converging on the portfolio grouping with favorable performance - risk profiles
- diversification is a deciding factor to arbitrage between portfolio weightings of potential value in any group
- diversification is measured as a ratio of the sum of weighted asset volatilities divided by portfolio volatility
- the more diversified the long-only portfolio, the lower its volatility will be, compared to the weighted sum of the asset's volatilities
- higher ratios are generated by lower portfolio volatilities, implying better diversification (marked by red dots)
This note will offer further information on array generation and relevance of optimization for the investor
However, ideally, personal experience of Pininvest Optimization is advisable - to make the best of the functionalities
To launch the Optimization command from a theme, it is recommended to select a very large set of assets, leaving the algorithm free to pick
The selection of a short time frame (up to 3 months) might generate the more relevant optimized portfolios
Prompted to set constraints, the investor may limit the number of trades in current positions (sales) and in the number of new assets picked in the selected list to generate tradable solutions
Portfolio generation - a probability distribution
For an intuitive understanding of portfolio generation, each singular set of asset weights specific to a unique portfolio will be seen as the primary constituent of statistical distributions
Broadening the scope from a single portfolio to an array, marginal weight shifts of each individual asset in a range from 0 to 100% will define an infinite distribution of portfolios
The distribution is bound by the key constraint that the sum of all asset weights in every portfolio will always be equal to 100%
It is hard to visualize the distribution of portfolios where a shift of one asset in a portfolio resets all the other constituents to stick to the 100% boundary and, in the process, defines another novel portfolio....
It could be said that the marginal asset weight shifts defining each of this infinite number of portfolios do not bring structure to the portfolio array as a whole
This is the ambitious goal achieved by a distribution formula which, in layman's terms, can be seen as a distribution overlaid on a distribution - the Dirichlet distribution
Dirichlet (1805-1859), a Prussian mathematician, devised the distribution which bears his name
The dimensions bringing structure to the portfolio array under Dirichlet are probability density functions - defining the likelihood of each individual portfolio outcome
The sole purpose of this summary presentation of portfolio distribution is to highlight the potentially infinite range of portfolios and the grouping bringing coherence to the portfolio arrays
Because of the limitations of this description, the statistical-minded readers may want to review the mathematics of the Dirichlet distribution
The efficient frontier
The frontier is the logical boundary of the portfolio array
- the lowest- and the highest portfolio returns set out a range of returns which can be explored stepwise - seeking out the lowest portfolio volatility at each step
- the construct is all encompassing - including a very large number of irrelevant portfolios - concentrated on a few 'best performing assets' and ignoring the merits of diversification
Constraints tighten the array of portfolios with restrictive rules
The settings by default can be adjusted at will
- Setting minimum and maximum weights for assets
- Restricting the amount to be traded, including potential 'buys' of new assets and 'sales' of current portfolio assets
- Delimiting the number of trades allowed - 'buys' as well as 'sells'
- Pressing for a minimum number of 'sells' in current asset positions
- Selecting a Dirichlet α parameter spreading - or concentrating - the distribution of the portfolio array
A balance between excessively restrictive constraints and a light touch will generate a full set of portolios
With more selective settings, or conversely, with too few limitations, the benefits of portfolio generation could prove limited
Diversification
Next to the popular Sharpe ratio, which is computed as risk-adjusted return by unit of risk, portfolio diversification might be the most relevant filter for an array of portfolios
Sharpe focuses on best performance at the lowest level of risk exposure
- Performance is 'excess return' defined as the portfolio's expected return adjusted for the risk free rate (such as the rate on U.S. Treasuries)
- Risk exposure is a measure of portfolio volatility, annualized on Pininvest
On the optimization chart locating the portfolios according to both ratios, Sharpe clarifies interpretations but adds few insights
Diversification is different
The ratio of diversification, computed for the array of portfolios, will prove very relevant to select optimized weightings
- The features of well diversified portfolios are commendable because the risk exposure of individual assets in the selection counteract in a lower portfolio risk
- To rank the portfolios by diversification, the sum of asset volatilities is divided by portfolio volatility
The lower portfolio volatility for a set of asset volatilities, the stronger the diversification factor of the porfolio
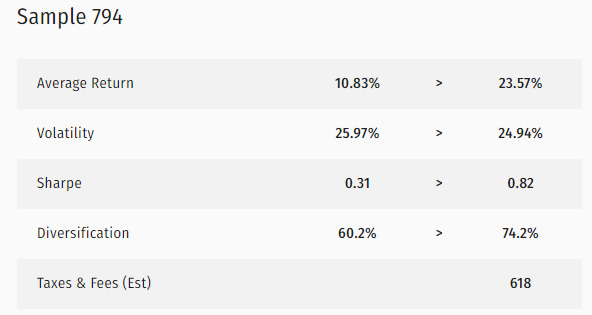
With an attractive return and volatility mix, reflected in an improved Sharpe ratio, Sample model 794 stands out because of a notable improvement in the diversification ratio
Screening
To focus on key "optimal" alternatives, highly similar portfolio simulations are eliminated and the remaining portfolios are grouped into clusters
- The closeness of two portfolios' asset allocations is measured by degree of compactness and a threshold value will control for the level of similarity between portfolios under consideration
- The preferred portfolios within each grouping of closely similar portfolios willl be the 20% most diversified portfolios, forming a "cluster"
- Both the threshold qualifying portfolios for 'similarity' and the percentage rate assigned to each grouping to form a cluster can be customized, depending on preferences
Because all computations are based on asset price series' history, tests backdating prices over shorter periods will translate in different performance and volatility ratio calculations
An in-depth evaluation of selected portfolio models, by comparison with current portfolio investments, is shown on the IMPACT interface, which highlights suggested trades and computes virtual performance, risk and diversification ratios accordingly