US Broad Market ETFs

US Broad Market ETFs
Components Performance/Risk
Period Return
22.5%
Return Rank
Average
Risk Exposure
Low Risk

With a view to cover the total market,  our selection of Broad Market ETFs accounts for much diversity

  • size is defined by various indices (Russell 3000, Core S&P Total US Market, MSCI USA ...) and by 'US Broad' or 'Total Market' concepts
  • fundamental criteria rely on stock selection methodologies of the broad base in some cases (such as environmental, social and governance characteristics - ESG - or on proprietary indices)

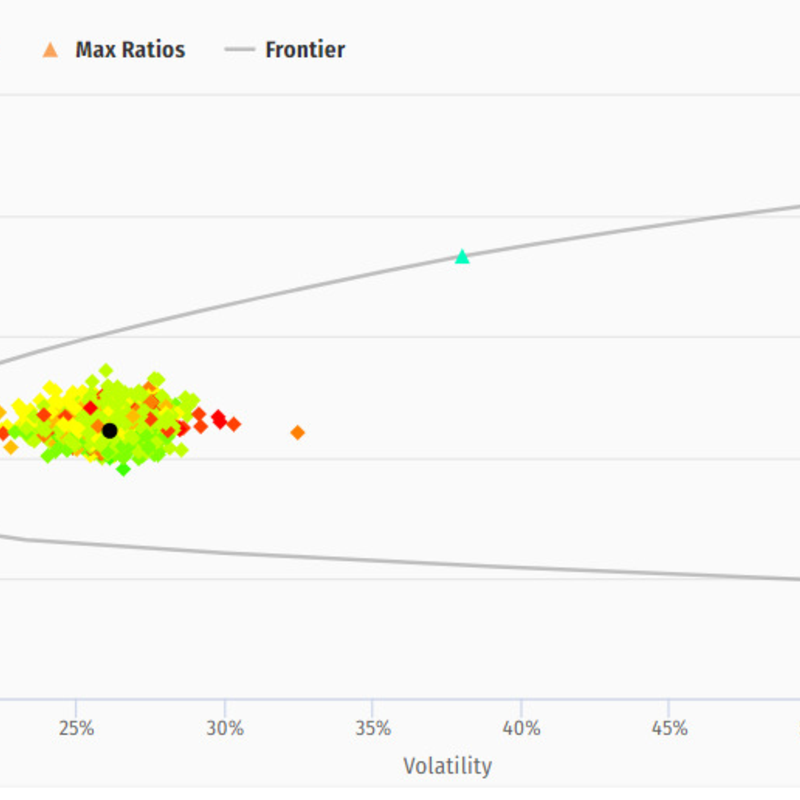
With distinct approaches to the global market, with or without fundamental selection methodologies, performance and risk ratios of the funds need to be analysed with care and never evaluated on past performance only


Our ETF US total market themes present a cross-sectional view of equity trends – in terms of market coverage, size and style. We hope to achieve a fair coverage of ETFs in each category, which is a work in progress

Theme Components
Name
Ticker
Category
SubCategory
Cur. Price
Performance
Momentum
Risk Rank
Risk Contrib
 
Vanguard Total Stock Market ETF VTI US EquityBroad Market (multi-factors)368.7622.4% Neutral Below Average
Vanguard Russell 3000 ETF VTHR US EquityBroad Market (multi-factors)330.2622.1% Neutral Below Average
Barron's 400 ETF BFOR US EquityBroad Market (multi-factors)23.8321.5% Weak Up Below Average
iShares Russell 3000 ETF IWV US EquityBroad Market (multi-factors)425.2621.2% Neutral Below Average
Schwab U.S. Broad Market ETFâ„¢ SCHB US EquityBroad Market (multi-factors)28.8721.6% Neutral Below Average
Schwab Fundamental U.S. Broad Market Index ETF FNDB AmericasUS30.6228.1% Weak Up Low Risk
iShares Core S&P Total U.S. Stock Market ETF ITOT AmericasUS163.7621.7% Neutral Below Average
First Trust Multi Cap Value AlphaDEX Fund FAB FactorsValue102.6325.8% Weak Up Below Average
iShares MSCI USA Equal Weighted ETF EUSA FactorsEqualWeight115.1417.7% Weak Up Low Risk
1 – 9 of 9