Tracked by the Chicago Board of Trade (CBOE), and in its own words, "the Volatility index (VIX) is a calculation designed to produce a measure of constant, 30-day expected volatility of the U.S. stock market, derived from real-time, mid-quote prices of S&P 500® Index (SPX℠) call and put options"
VIX is a contrary market indicator – earning its name of ‘fear index’ by signaling the implied volatility of option premiums, depending on the supply and demand for options
When there is uncertainty in the market, VIX will tend to rise with the increased demand of options puts (which protect the portfolio owner in a falling market)
Just as surely, the VIX will fall back when market uncertainty subsides
The tendency to revert to a mean – in a price range of 18-35 – rarely provides a clear signal, as the VIX chart over the 12-months period shows amply, and extreme price movements, such as occurred between February 10 and March 16, 2020, are hard to anticipate and reversals are just as unpredictable
VIX price signals for trading purposes remain ambiguous because the main function of the underlying options is to insure portfolios, mainly run by financial institutions, against potential market uncertainty
Since uncertainty is a matter of perception and, what is more, of forward-looking perception, VIX signals are by themselves poor predictors of future market trends, which need to be broadly shared to gain relevance
The VIX index could offer guidance as soon as the large institutional market operators prepare to take on more insurance (pushing up the VIX by way of option puts) …
… which will in fact be too late to preempt perceived market downturn
However, trade volumes of ETFs invested in long volatility futures will be the most valuable indicators of surging demand in anticipating a rise in the VIX index (and in the underlying options premiums)
It is hard to deny that the current financial markets are set-up for great tension, and potentially for a significant downturn
Macroeconomics cannot ignore the convergence of potent negative indicators:
- war and military tension around the world,
- pressure on the energy markets,
- 11 interest rate hikes since March 2022, stressing investment plans for business and for individuals
- high yields in the bond market (20- and 30-year maturities),
- US distraction between multiple foreign theaters, aggravated by domestic ‘theater’
A theme and a test case
The theme ‘VIX – Trading Volatility’ – a selection of long only short-term and mid-term volatility futures and a very poor performer of the past year – delivers a clear signal of market reversal
- Performance over the past 3 months - 12.6% - in a range of 4.7% to 10.1% (long volatility ETFs only - setting aside interest rate hedged ETFs)
- Performance over 15 days - 3.4% in a range of 3.2% to 4.8% (long volatility ETFs only - setting aside interest rate hedged ETFs)
Check performance over different time frames (15 days to a full year) from the menu - top right of the theme
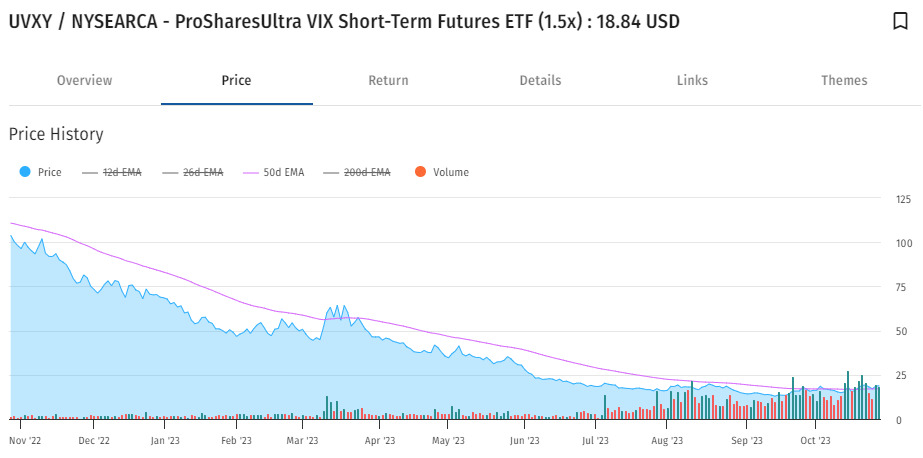
Surging interest in long short term volatility ETFs is the expression of shared concern in more volatile markets, with daily trades into 20 to 30 million shares (compared to 2-3 million shares earlier this year)
VIX at the low end of its normal range (20) is expected to trend up - signaling potential trouble in the equity market
...as this screenshot of